 CoinTrendzBot
Telegram S&P 500 Stock Market Heatmap Bot
Scan up to 500 U.S. stocks by color, market-cap weight, and price performance without leaving your Telegram chat or group.
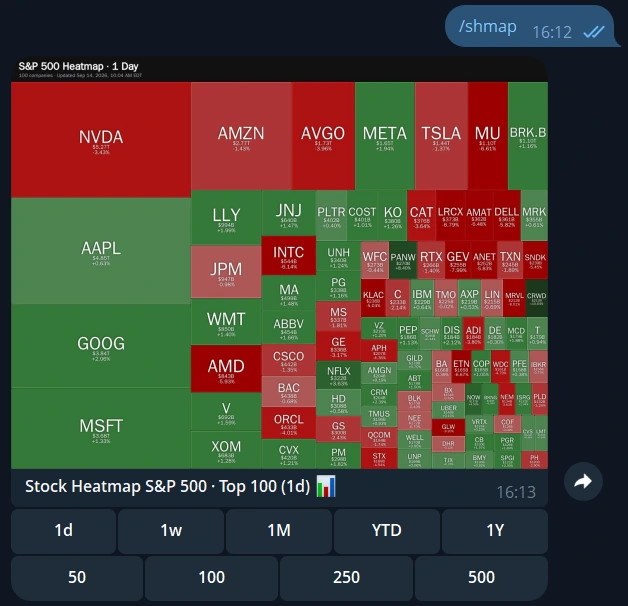
How to read an S&P 500 heatmap in Telegram
The map replaces a wall of quotes with one visual market snapshot. Color answers what moved, tile size shows which companies carry more market weight, and the period controls reveal whether the pattern is fresh or persistent.
Read direction by color
Green stocks gained over the selected period and red stocks declined; stronger shades indicate larger percentage moves.
Notice heavyweight moves
Tiles are sized by market capitalization, so moves in the largest S&P 500 companies are visually prominent.
Control the level of detail
Show any number from 1 to 500 stocks, or use the quick buttons for 50, 100, 250, and 500.
Change the comparison period
Move between 1D, 1W, 1M, YTD, and 1Y while keeping the result inside the same Telegram message.
Telegram /shmap command syntax
Both parameters are optional. Without them, /shmap displays the top 100 S&P 500 stocks over one day.
/shmap [stock count] [timeframe]
Post a stock heatmap in three steps
Start with the default overview, then refine it without memorizing every parameter.
Open CoinTrendzBot
Start the bot privately or add it to the Telegram group where you discuss U.S. stocks.
Send /shmap
The default command returns a one-day heatmap of the 100 largest available S&P 500 companies.
Adjust the view
Tap a stock-count or timeframe button, or run a custom example such as /shmap 500 YTD.
Give your Telegram group a shared view of market breadth
One image can start a better discussion: is the whole market moving, are declines concentrated, or are a few mega-cap names masking weakness elsewhere?
- Top 1–500 S&P 500 stocks
- Market-cap-weighted treemap
- Five selectable performance periods
- Interactive controls below the image
- No paid plan required
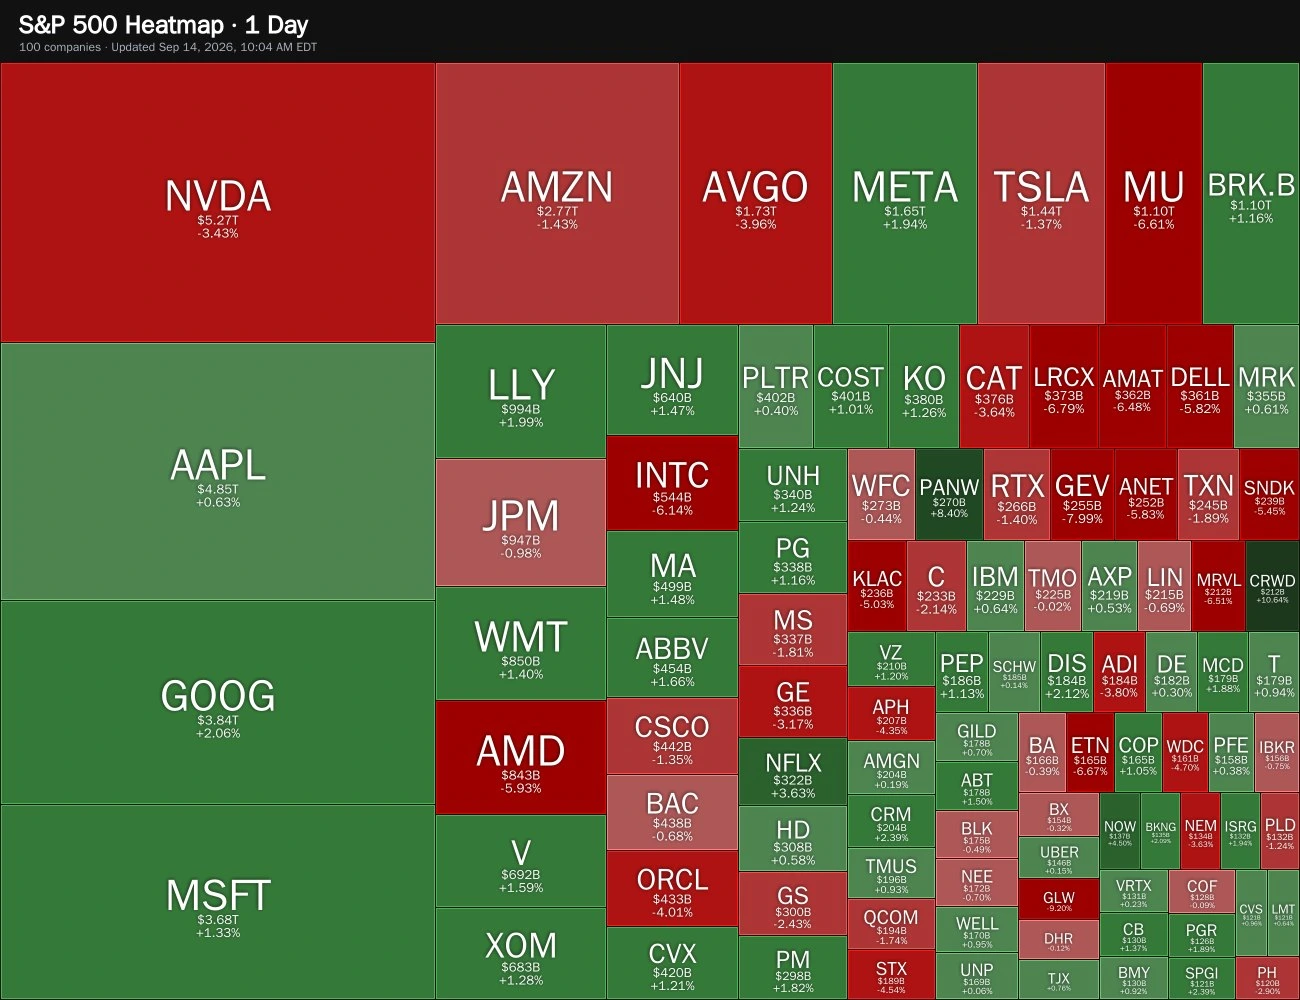
Use every /shmap view for free
Stock counts up to 500 and all five heatmap periods are included in the free CoinTrendzBot for Telegram.
Questions, ideas, or market observations?
Join the CoinTrendz community
Meet other traders, learn how people use CoinTrendzBot, and discuss new market features.

Prefer a different platform?
Explore the other heatmap versions
Telegram stock heatmap questions
Explore more CoinTrendzBot commands