Free Command Telegram Discord

See the S&P 500 in One Stock Market Heatmap

Turn hundreds of U.S. stocks into a visual map of market leaders, laggards, and heavyweight moves—directly inside Telegram or Discord.

10:32
5G
CoinTrendzBot
CoinTrendzBot
online
Today
/shmap 100 1d
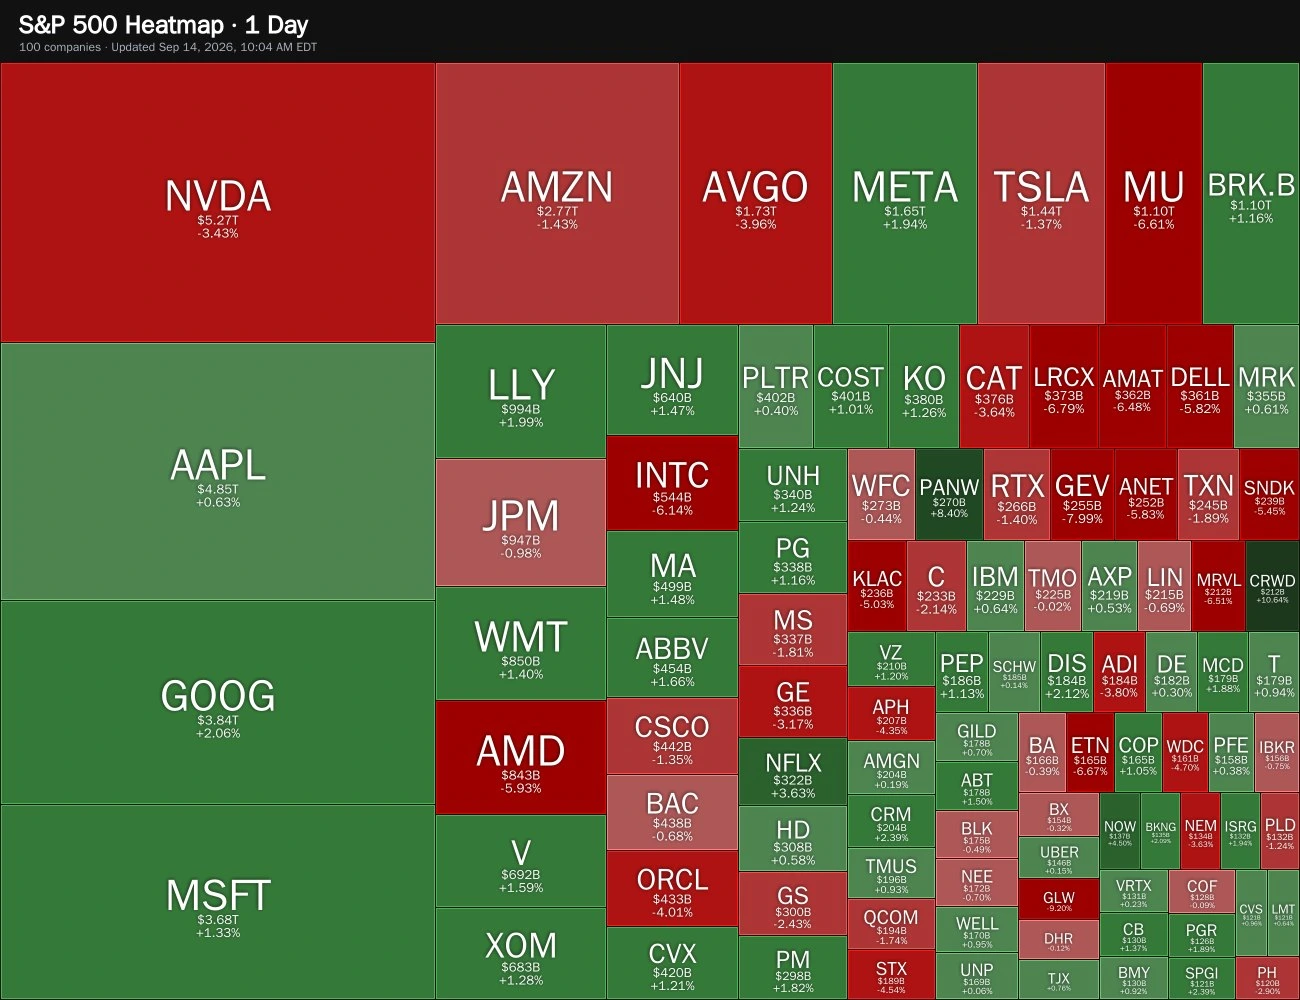
S&P 500 US stock market heatmap showing the top 100 companies by market capitalization and daily performance
📊
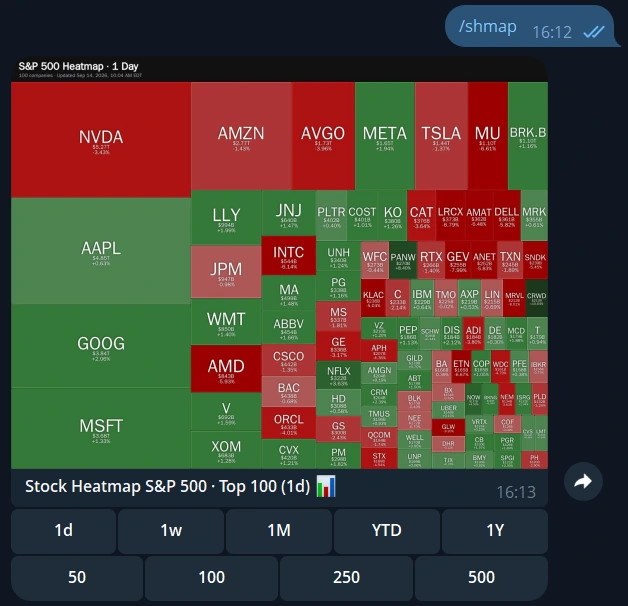
Stock Heatmap S&P 500 · Top 100 (1d)
Green = gain · Red = loss
10:32
Message
Display 1–500 stocks from the S&P 500
Compare 5 periods from 1D to 1Y
/shmap free command

Read the market before reading every ticker

A long list of stock prices makes it difficult to see the bigger picture. The /shmap command turns S&P 500 performance into a color-coded treemap: green tiles gained, red tiles fell, and larger companies occupy more space. In a few seconds, you can see whether strength is broad, weakness is widespread, or a handful of market heavyweights are driving the index.

  • Choose any stock count from 1 to 500, with the top 100 shown by default.
  • Compare daily, weekly, monthly, year-to-date, or one-year percentage performance.

What the heatmap reveals

  • S&P 500 winners and losers
  • Market-cap-weighted tile sizes
  • Five performance periods
  • Selectable stock count
  • Ticker, market cap, and price change

Open a U.S. stock heatmap in your group chat

Use the same command on Telegram or Discord, then change the timeframe or number of stocks from the buttons below the result.

Telegram

Post an S&P 500 heatmap in a private chat or group, then tap to compare 50, 100, 250, or 500 stocks across five periods.

Command syntax
/shmap [1-500] [1d|1w|1M|YTD|1Y]
Examples
/shmap /shmap 50 1d /shmap 250 1M /shmap 500 YTD
View Telegram guide

Discord

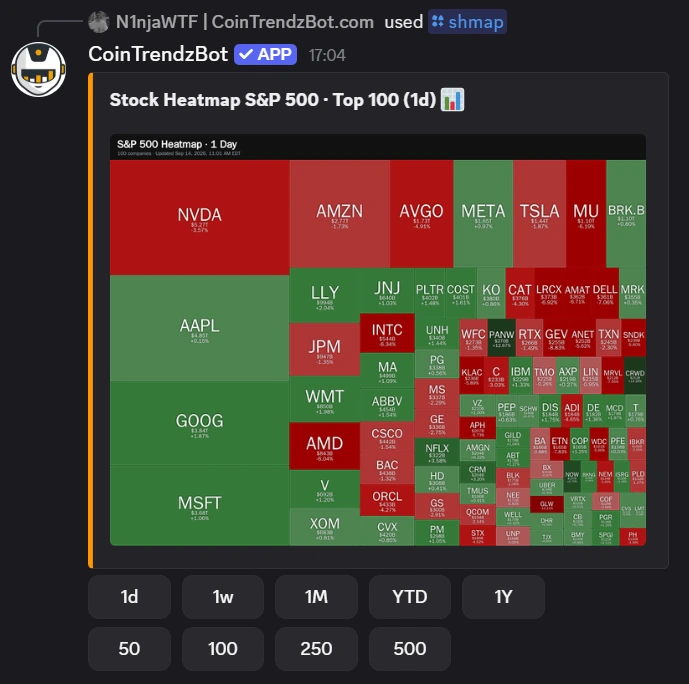
Bring a market-cap-weighted U.S. stock performance heatmap into a Discord channel with selectable depth and timeframe.

Command syntax
/shmap [1-500] [1d|1w|1M|YTD|1Y]
Examples
/shmap /shmap 50 1d /shmap 250 1M /shmap 500 YTD
View Discord guide

Choose the depth and timeframe

Run /shmap alone for the top 100 stocks over one day, or add a stock count and period for a more focused or complete market view.

Command syntax
/shmap [1-500] [1d|1w|1M|YTD|1Y]
/shmap
/shmap 50 1d
/shmap 250 1M
/shmap 500 YTD
Command syntax
/shmap [1-500] [1d|1w|1M|YTD|1Y]
/shmap
/shmap 50 1d
/shmap 250 1M
/shmap 500 YTD

S&P 500 heatmap preview

Color shows percentage performance while tile size reflects market capitalization, making influential winners and losers stand out.
Telegram example
S&P 500 stock market heatmap generated with /shmap in Telegram
Discord example
U.S. stock market performance heatmap generated with /shmap in Discord
Free Command

Explore all 500 stocks for free

Every supported stock count and timeframe is included with /shmap on the free Telegram and Discord bots.

Want a platform-specific walkthrough?

Learn how to use /shmap in your chat app

Move from market overview to individual stocks

Use the heatmap to find areas worth investigating, then open a price, chart, movers, or market-rotation view for more context.

U.S. stock heatmap questions

It maps S&P 500 constituents by percentage performance for the selected period. Each visible tile can show the ticker, market capitalization, and price change, giving you a compact overview of leading and lagging U.S. stocks.

Green represents a gain and red represents a loss. The shade becomes stronger as the move grows, while tile area reflects market capitalization, so larger companies take up more space.

Choose any number from 1 to 500. /shmap defaults to the top 100 S&P 500 companies, and quick buttons let you switch between 50, 100, 250, and 500.

The supported periods are 1 day, 1 week, 1 month, year to date, and 1 year. Use 1d, 1w, 1M, YTD, or 1Y in the command or select a button beneath the chart.

It can help you assess market breadth, notice clusters of strength or weakness, and see whether large-cap stocks are dominating the move. It is a visual research tool rather than a buy or sell signal.

The chart uses the latest available S&P 500 performance data when the command is run. U.S. market prices can change quickly during trading hours, so rerun the command when you need a newer snapshot.

Yes. The U.S. stock market heatmap, all five periods, and stock counts up to 500 are free on Telegram and Discord.

Explore more stock market tools

Discover all CoinTrendzBot commands

Top