Crypto ETF Flows Tracker
Follow Bitcoin and Ethereum ETF inflows, outflows, and fund flow activity directly in Telegram and Discord.
What it does
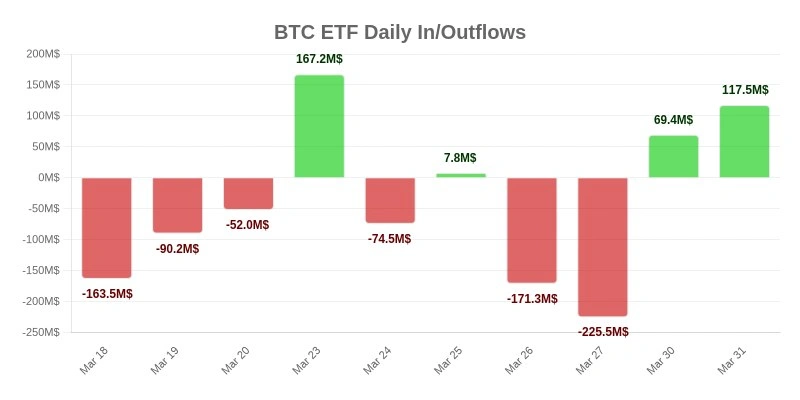
The Crypto ETF Flows Tracker gives traders, investors, and crypto communities a fast way to check ETF flow activity without leaving chat. Use the /flows command to view Bitcoin and Ethereum ETF inflows, outflows, and recent fund movement data directly inside Telegram or Discord conversations.
- Use /flows to pull crypto ETF flow data in seconds.
- Review ETF inflows, outflows, and capital movement updates right inside your chat.
Why it’s useful
- Fast ETF flow lookups
- Bitcoin and Ethereum coverage
- Inflow and outflow visibility
- Useful in groups and DMs
- Telegram and Discord support
Platform availability
See how this feature works on each supported platform.
Telegram
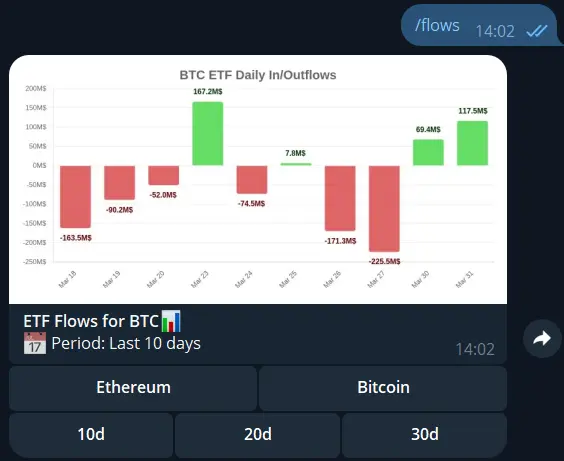
Use this command directly in Telegram chats and groups.
/flows
Discord
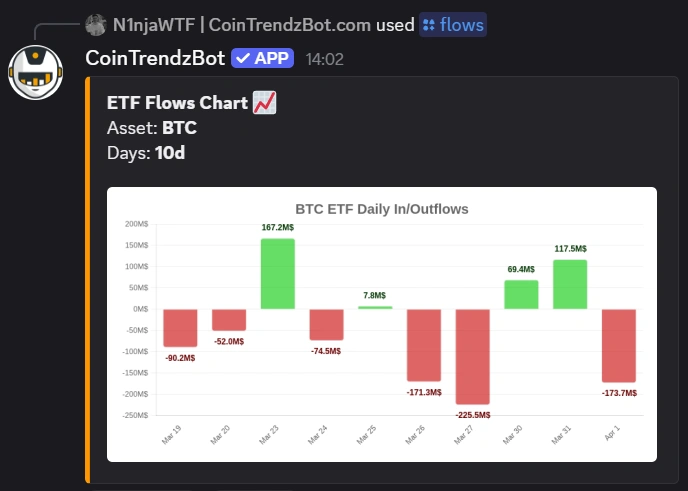
Use this command directly in Discord servers and channels.
/flows
Example commands
Try one of these example chat commands.
/flows
/flows
/flows
/flows
Group Chat Preview
See what the command can look like in chat.
Included for free
Use this feature anytime to check crypto ETF inflows, outflows, and fund flow activity directly in chat.
Frequently asked questions
Explore more tools and commands