Telegram Crypto RSI Heatmap Bot
Analyze overbought and oversold conditions across the crypto market using an RSI heatmap directly inside Telegram.
How to use the Crypto RSI Heatmap on Telegram
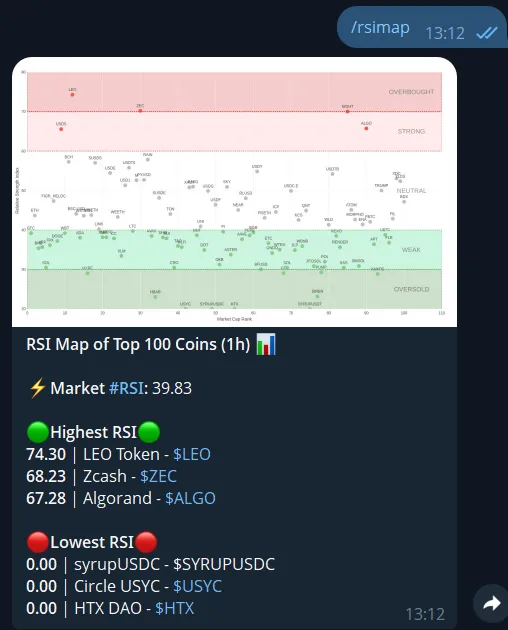
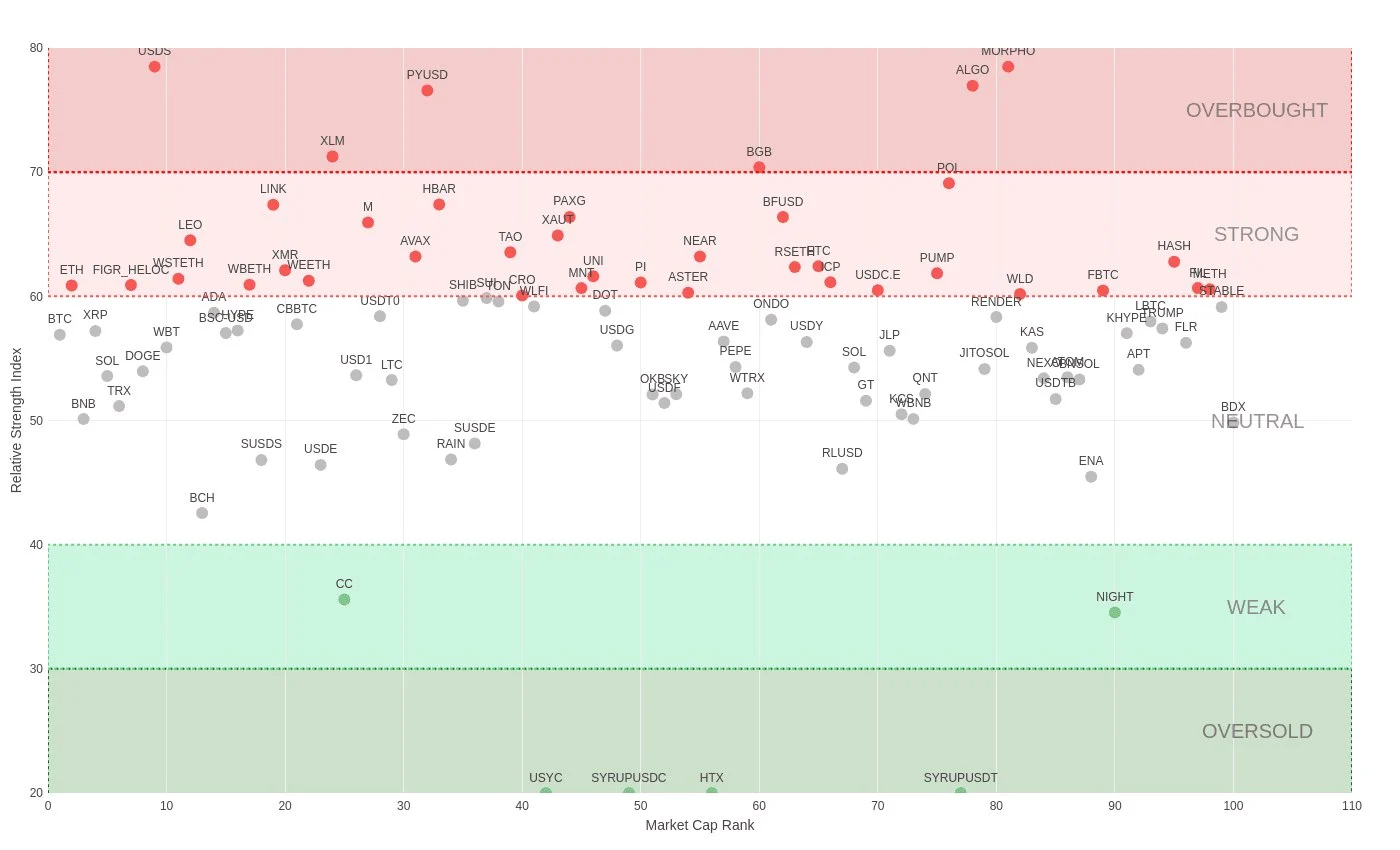
The /rsimap command gives you a fast overview of market momentum using RSI (Relative Strength Index). Instantly see which coins are overbought, oversold, or neutral across the market. This helps traders spot potential reversals, identify trends, and make faster decisions without leaving Telegram.
RSI heatmap view
Visualize RSI levels across multiple cryptocurrencies in a clean heatmap format.
Spot overbought/oversold
Quickly identify coins that may be overbought or oversold based on RSI values.
Perfect for groups
Share RSI insights instantly in Telegram groups for collaborative analysis.
Instant analysis
Run a simple command and get a full market overview in seconds.
Telegram command syntax
Use the command below inside Telegram to view the crypto RSI heatmap.
How to use /rsimap command on Telegram
Start analyzing crypto RSI levels in just a few steps.
Start the bot
Open CoinTrendzBot on Telegram and begin a private chat.
Add it to your group
Invite the bot to your Telegram group to share RSI insights with others.
Run the command
Type /rsimap to instantly view the crypto RSI heatmap.
Perfect for Telegram groups
The RSI heatmap is ideal for trading groups that want quick insight into market momentum and potential reversals.
- Instantly visualize RSI levels across multiple coins
- Great for spotting potential reversals and trend strength
- Enhances group discussions with data-driven insights
- No need to switch to external charting tools
- Helps traders align on market conditions quickly
Use this RSI heatmap bot for free
Analyze crypto RSI levels and market conditions directly inside Telegram at no cost.
Need help or want to connect with other users?
Join the CoinTrendz community
Join our Telegram community group to discuss RSI strategies, market trends, and trading ideas.

Using a different platform?
See the other versions of this feature
Frequently asked questions
Explore more CoinTrendzBot Commands